How to use Twitter Analytics
You might want to look more closely at your tweet statistics if, when using Twitter, you start to wonder how much engagement your tweets actually receive. Just so much about how your tweets are being perceived can be inferred from the quantity of likes, retweets, or comments. But, looking at your tweet analytics will help you understand better how well your tweets are connecting with your audience.
You must go to your account’s Twitter Analytics dashboard to examine your tweet analytics. This page will display not just the like and retweet statistics for your tweets, but also more specific metrics like impressions and account metrics like following and mentions. We’ll demonstrate how to access your Twitter Analytics dashboard and specific tweet analytics in this article. We’ll also respond to some of your queries about Twitter Analytics.
What can Twitter Analytics tell you? A quick tour of the dashboard
The daily-updated Twitter Analytics dashboard is a webpage that provides a plethora of data on your tweet activity and the reactions of other Twitter users to your tweets. The dashboard’s Home tab, which displays a 28-day recap of your tweet activity and account stats, is what you see when you first access it. You may view recent trends on the analytics dashboard, including how frequently you tweet, how many impressions your tweets received, how many people visited your profile, how many mentions you received, and your current number of followers (including whether or not these numbers have gone up or down recently).
You can find statistical breakdowns of your tweet activity each month by scrolling down the Home page of your dashboard. The dashboard will actually highlight your top tweets and mentions in these monthly recaps and list your top followers. Also, you’ll see broader information regarding the activity of your account and your tweets.
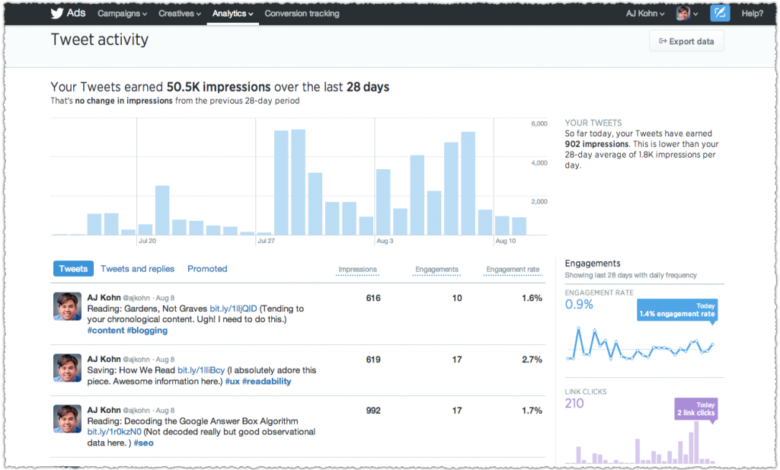
You may view a graph of the number of impressions your tweets received over a 28-day period by selecting the Tweets tab. Impressions are the total number of times that other users have seen one of your tweets. Your individual tweets are listed on the Tweets page as you scroll down, with the metrics impressions, engagements (the number of times other users connect with your tweets through actions like clicks and likes), and engagement rate displayed for each tweet (which is the number of engagements divided by the number of impressions). You can also click on any of the listed tweets to see a more thorough Twitter Activity screen that provides a more in-depth breakdown of your interactions.
The Engagements column, which is located on the right side of the screen, displays graphs of various metrics like engagement rate, link clicks, and replies.
Can anyone use Twitter Analytics?
Yes, you may use the Twitter Analytics dashboard without having a certain kind of Twitter account in most cases. This means that neither a blue-check account nor a Twitter Blue subscription appear to be necessary. Generally speaking, any free, ordinary Twitter account should be able to access the Twitter Analytics dashboard as long as it satisfies the few minimal conditions specified below.


The prerequisites for using the Twitter Analytics dashboard are as listed in Twitter’s help article on the subject:
- The age of the account must be a minimum of 14 days.
- It can’t breach Twitter’s ads policy.
- It can’t be a deleted, suspended, or restricted account.
- The primary language of the account must be one of those specified in the Twitter support page that was previously mentioned. Japanese, Spanish, and English are a few examples of them.
How to access Twitter Analytics via the desktop website
With Twitter’s desktop website, you may access the complete Twitter Analytics dashboard. Just adhere to the directions listed below.
Step 1: If you haven’t already, visit Twitter.com and log in to your account.
Step 2: Once you’re logged in, select More.
Step 3: Choose Analytics from the menu that appears. Your Twitter Analytics dashboard should appear in a new browser tab when it launches.
How to access Twitter Analytics via the mobile app
Sadly, the mobile app doesn’t offer access to the complete Twitter Analytics dashboard. However, you can still get the metrics for each of your individual tweets even though the Twitter Analytics dashboard isn’t available on the mobile app. This is how to accomplish it:
Step 1: Launch the smartphone app and find the tweet you want to read. It must be a tweet that you posted (so either a regular tweet or a quote tweet you wrote).
Step 2: Choose the icon that resembles a bar graph from the collection of retweet and like icons located at the bottom of that tweet (three vertical lines of varying heights). This will bring up a screen for that tweet’s activity on Twitter.
Step 3: You may view a few tweet interaction data on the Tweet Activity screen, including the amount of impressions, engagements, and new followers that were gained as a result of that tweet.